In this chapter, the simulation results are displayed and explained.
Contents
Simulation results and selection of alternatives
Figure 1 shows an overview of the simulation results page that can be called up via the |
|
button in the menu of the application. |
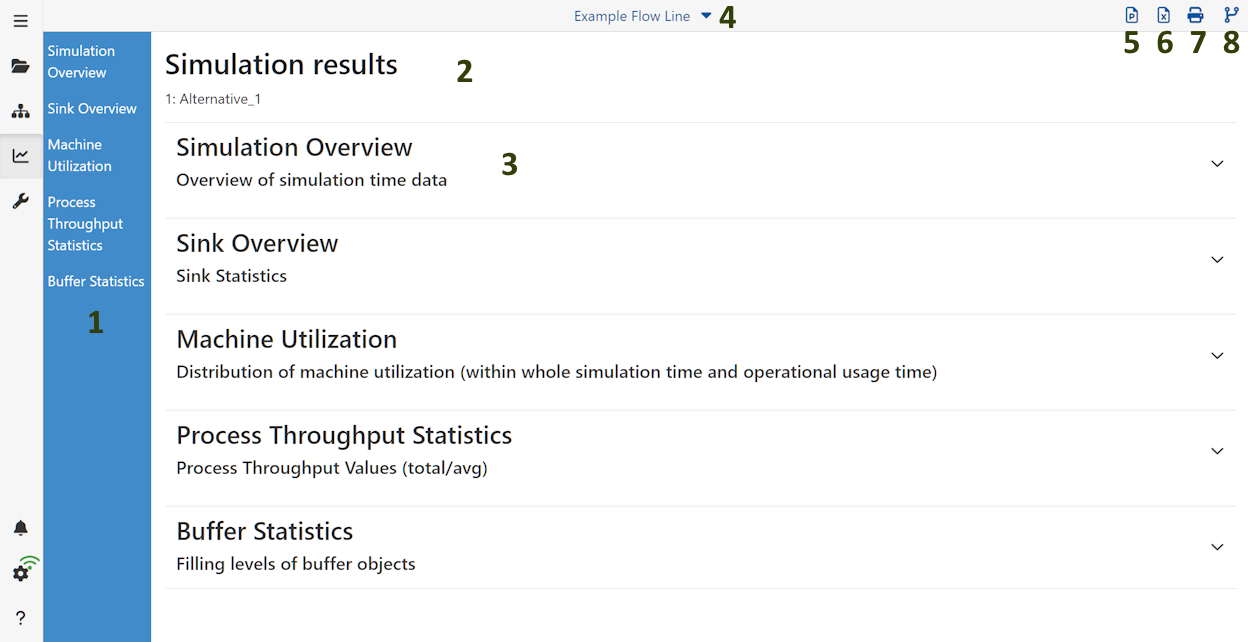
Figure 1 - Result menu
In this area all calculated statistics are shown. Each key figure is clickable to jump directly to the respective statistic.
![]() Simulation results and selection of alternatives
Simulation results and selection of alternatives
The name of the modeling alternative whose results can be viewed is displayed directly below the title (here: "Alternative_1" )
The largest area in the simulation results is intended for the representation of the same. Here, all result categories listed in the menu on the left are displayed in a hinged tree structure.
The Alternatives button can be used to show or hide alternative models in the simulation results. The prerequisite for this option is that the alternatives have been simulated beforehand (see 8 in figure 1).
In order to compare alternatives, they must first be added to the simulation results as described above.
Then the existing tree structure of the simulation results can be expanded and the selected alternatives can be compared.
The presentation of the results depends on the order in which the models are listed in the upper part of the application.

Figure 2 - Comparison of alternatives
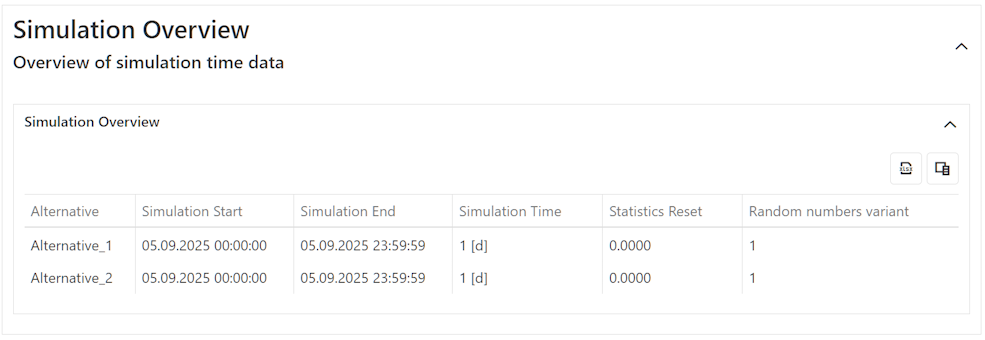
Figure 3 - Simulation overview
For details see chapter Overview modeling surface, section 6.
A click on this button saves the currently opened result view as *.pptx file.
A click on this button saves the currently opened result view as *.xlsx file.
A click on this button opens the print dialog to print the result view.
A click on this button opens up the alternative side bar. Here the user can select all alternatives that have simulation results in order to compare them directly to each other.
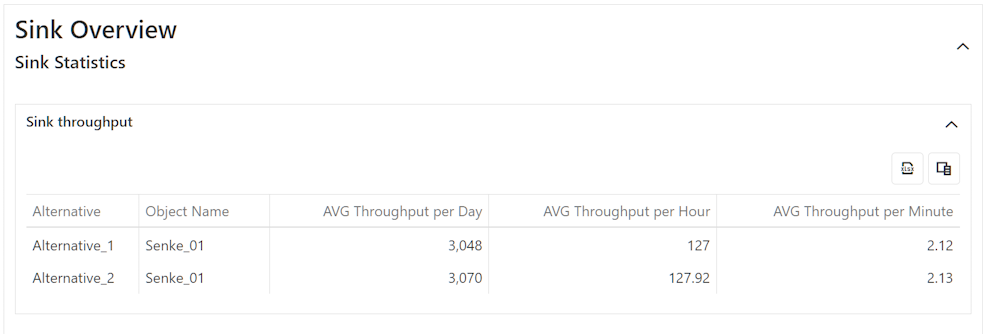
Figure 4 - Sink overview
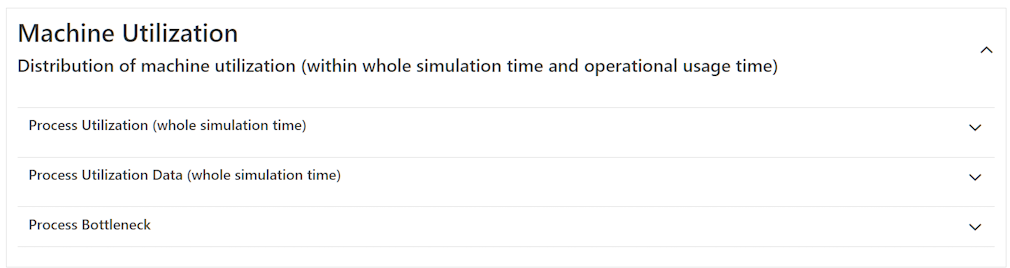
Figure 5 - Machine utilization overview
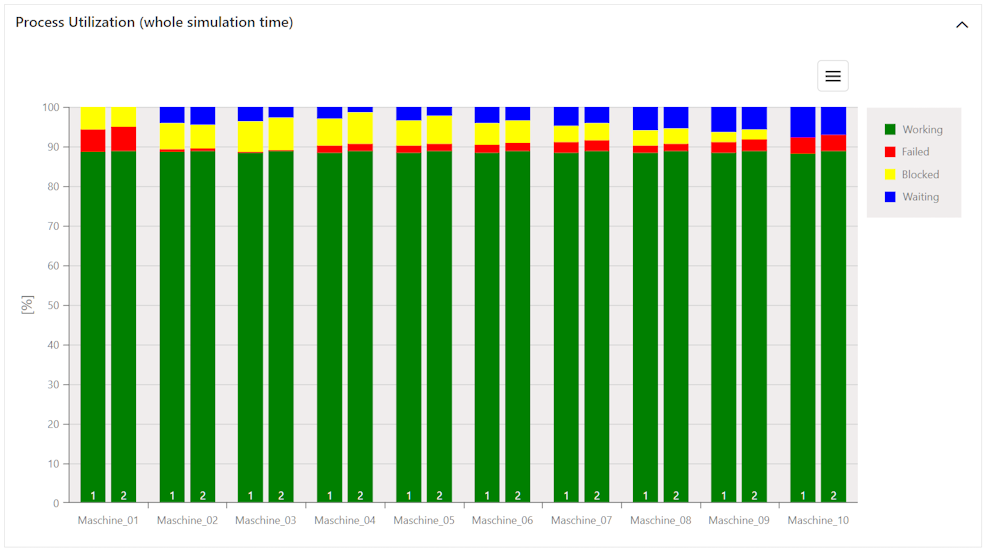
Figure 6 - Process utilization
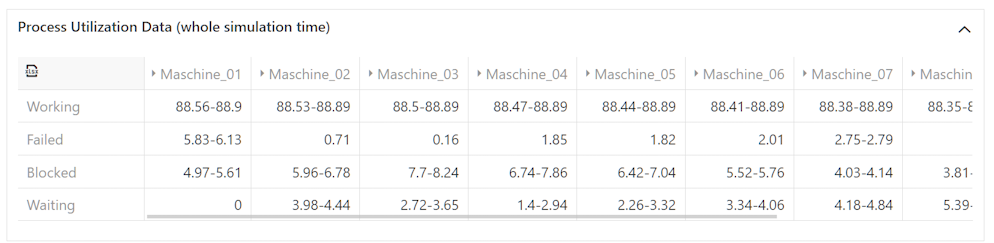
Figure 7 - Process utilization data
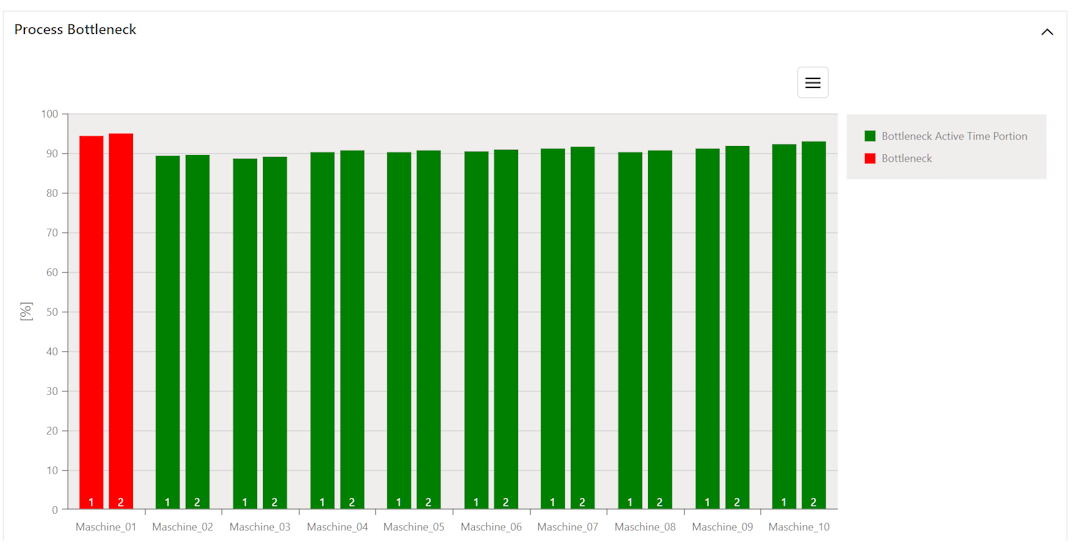
Figure 8 - Process bottleneck
7. Process throughput statistics
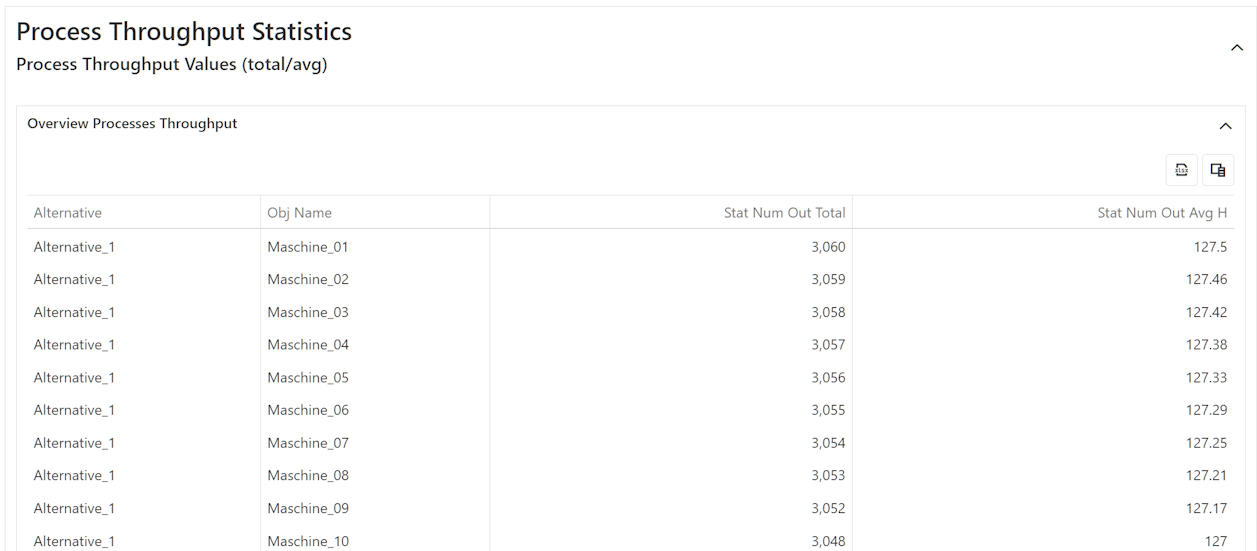
Figure 9 - Throughput statistics
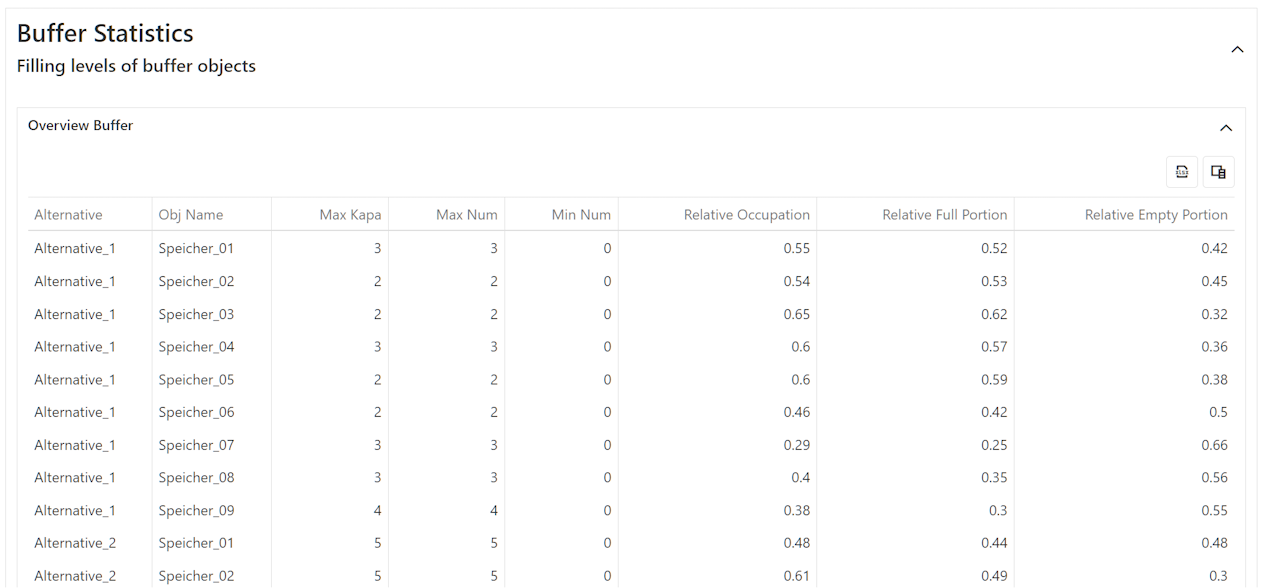
Figure 10 - Buffer statistics
© SimPlan AG - Hanau District Court, Commercial Register (Part B) 6845 - info@simplan.de - www.simplan.de/en